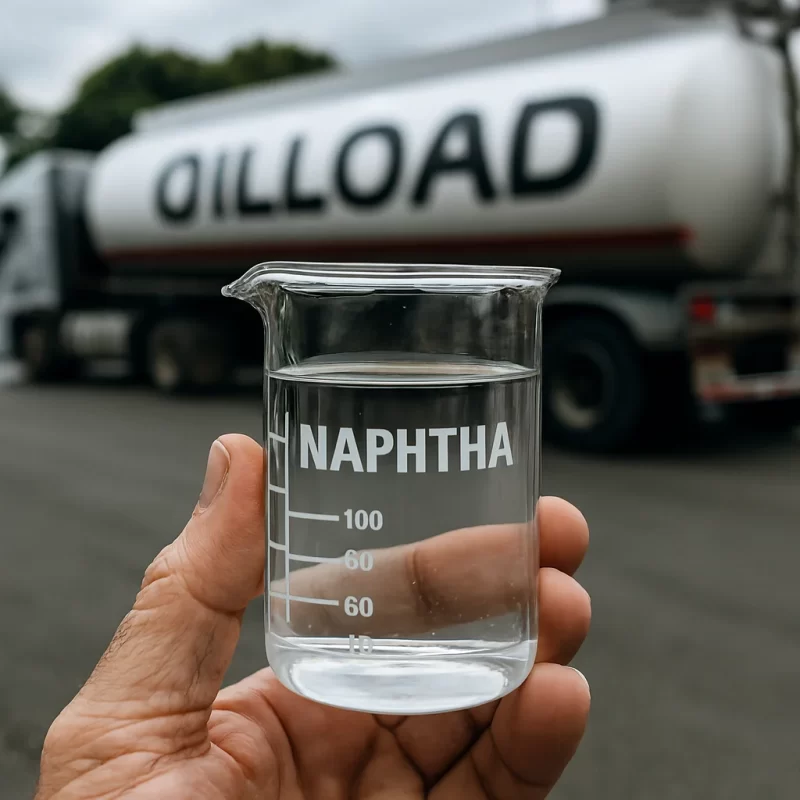
In the global energy sector, diesel fuel remains a cornerstone for transportation, industry, and power generation. Accurate sampling is critical to verify fuel quality, compliance with standards, and prevent disputes over off-specification cargo. Improper sampling can lead to misrepresentation of fuel properties like density, sulfur content, and contamination levels, resulting in financial losses or operational failures. This is particularly relevant for long-haul supplies crossing borders, where environmental factors and handling practices can alter fuel integrity.
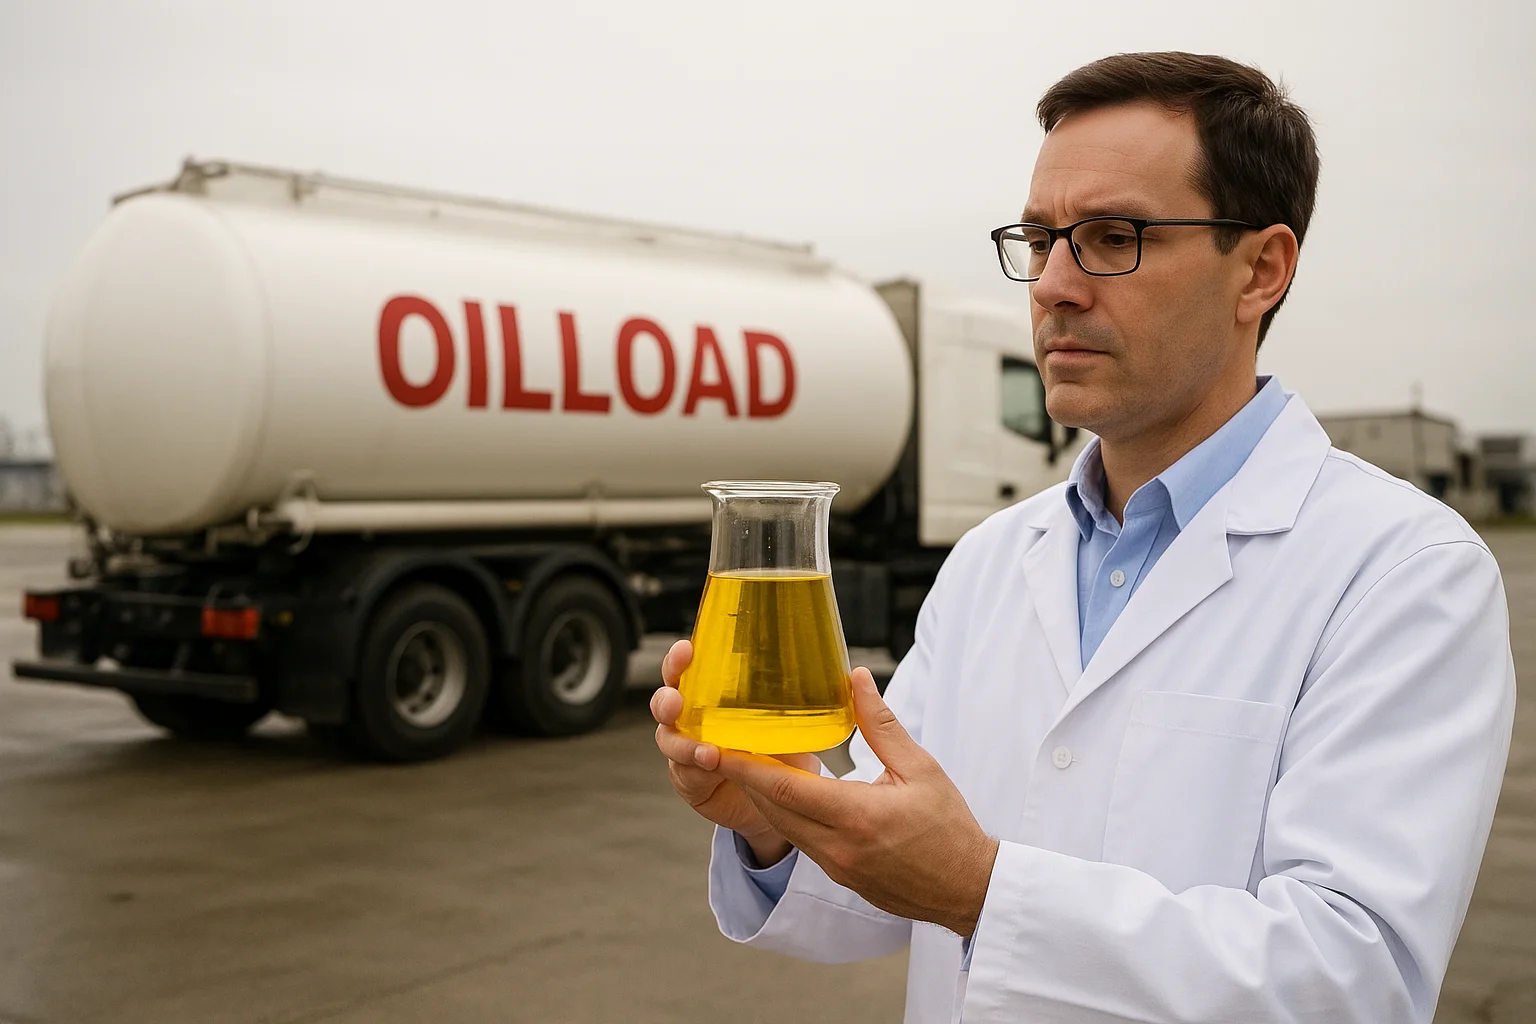
A prime example of excellence in this domain is the Oil Load Group, a leading diesel producer based in the Kurdistan Region of Iraq. Specializing in high-quality refined products like diesel (up to 10,000 ppm sulfur variants tailored for regional needs), the company sources from key refineries in Sulaymaniyah, Erbil, Kirkuk, and Zakho. Oil Load Group adheres to international standards, including Afghanistan's 2025 import mandate of maximum 2,000 ppm sulfur, cetane index, and viscosity requirements, ensuring reliable delivery to destinations like Afghanistan and Uzbekistan. Their commitment to compliance underscores the importance of robust sampling protocols throughout the supply chain.
This article explores best practices for sampling diesel fuel tankers, focusing on methods at various locations: top hatches, bottom hatches, combinations of partitions, and the middle. It also examines density variations due to temperature stratification, provides a comparative analysis of sampling points, and discusses how transportation impacts fuel analysis from origin to destination.
Understanding Diesel Fuel Sampling Methods
Diesel tankers typically feature 4 to 6 compartments (partitions) to stabilize load during transit, each with access points like hatches. Sampling must be representative to capture the bulk fuel's characteristics, avoiding bias from settling contaminants or evaporation. According to industry guidelines, tanks should not be recently filled or agitated before sampling to prevent mixing that skews results. Samples are collected in clean containers, labeled with details like date, time, location, and sampler initials, then analyzed for properties such as density, viscosity, and particulates.
1. Sampling from Top Hatches
Top sampling accesses the fuel surface via open hatches, often using a weighted bottle or thief sampler lowered on a line. This method yields the "cleanest" sample, as lighter vapors and volatiles concentrate at the top, while heavier sediments settle below. It's ideal for detecting water or microbial growth at the interface but may underrepresent overall density or contaminants. Best for oxidative stability tests, where surface exposure matters.
2. Sampling from Bottom Hatches
Bottom sampling, via outlet valves or dedicated ports, captures the densest layer, including potential water, sludge, or rust. A valve is opened briefly to drain into a sample jar, ensuring no air ingress. This is preferred for contamination checks, as heavier particulates accumulate here. However, it risks overemphasizing sediments, making it less representative for bulk quality unless combined with other points.
3. Sampling Through a Combination of Several Tanker Partitions
Tanker partitions divide the load for safety and efficiency. To sample across 4-6 compartments, use multi-point thieves or zone samplers that draw from each section proportionally (e.g., equal volumes per partition). This composite method provides the most holistic view, averaging variations between fore/aft or port/starboard sections. It's essential for large-volume cargos, as per maritime guidelines, to resolve off-spec claims by proving uniformity.
4. Sampling from the Middle of the Tanker
Mid-level sampling targets the core bulk using extended probes or bacon samplers inserted through hatches to the tank's midpoint (typically 50% depth). This avoids extremes of top volatiles or bottom sediments, offering a balanced profile for routine quality checks like cetane number or flash point. It's quick and cost-effective but may miss subtle stratifications if not depth-calibrated.
For all methods, follow protocols like those in NIST Handbook 158: use clean, dedicated equipment; sample in triplicate; and store at controlled temperatures to preserve integrity.
Density Variations in Diesel Fuel: The Role of Temperature Stratification
Diesel density is a key quality metric, standardized at 824 kg/m³ (or 0.824 g/cm³) at 15.6°C. However, temperature gradients in tanks cause stratification—warmer fuel expands and rises (lower density), while cooler fuel contracts and sinks (higher density). A mere 1°C difference can alter density by ~0.1%, impacting volume measurements and pricing. In static tanks, solar heating warms the top (e.g., +5-10°C above ambient), while the bottom cools via conduction, creating a gradient of 2-5°C or more across height. During transport, agitation reduces this, but prolonged exposure in hot climates exacerbates it.
Comparative Analysis: Sampling at Top, Middle, and Bottom
Assuming a typical stratification in a partially filled tanker (top at 25°C, middle at 20°C, bottom at 15°C—based on observed gradients in hydrocarbon storage), densities deviate from the standard. Bottom samples show higher density (cooler, contracted fuel), top samples lower (warmer, expanded), and middle approximates the average but still varies. This can lead to discrepancies: a top sample might indicate "light" fuel (underestimating mass), while bottom overestimates contaminants' impact.
The table below compares corrected densities (using volume correction factors, VCF, to 15°C equivalent) for these points, starting from the 824 kg/m³ standard. Calculations apply VCF derived from ASTM D1250 standards for diesel.
| Sampling Location | Assumed Temperature (°C) | Measured Density (kg/m³) | Corrected Density at 15°C (kg/m³) | % Difference from Standard |
|---|---|---|---|---|
| Top Hatch | 25 | 815.6 | 823.3 | -0.08% |
| Middle | 20 | 820.7 | 824.0 | 0.00% |
| Bottom Hatch | 15 | 824.0 | 824.0 | 0.00% |
Notes: Measured density = 824 × VCF(T). Correction uses VCF to normalize. Differences arise from thermal expansion (α ≈ 0.00085/°C for diesel). In extreme cases (e.g., 10°C gradient), deviations can reach ±0.8%.
Higher temperature → lower density in Diesel
Lower temperature → higher density in Diesel
This affects fuel volume, combustion efficiency, and storage calculations.
🧪 Why Bottom Sampling Shows Higher Density
Water and Sediment Accumulation: Over time, water (from condensation or contamination) and heavier particles settle at the bottom. Since water is denser than diesel, bottom samples may show artificially high density due to contamination.
Temperature Gradient: The bottom of the tank is usually cooler, especially in large tanks or during transport. Cooler diesel is denser, so bottom samples may naturally have slightly higher density.
⚠️ Risks of Bottom Sampling
False Readings: If the sample includes water or sludge, the density reading won’t reflect the true quality of the diesel.
Fuel Quality Issues: Bottom samples may not represent the fuel that will be used, especially if the tank is well-mixed or fuel is drawn from mid-level outlets.
✅ Best Practice
Middle Sampling (or Composite Sampling): For accurate and representative density, fuel is usually sampled from the middle of the tank or using a bottom-middle-top composite. This avoids extremes and gives a true average.
🔍 Summary
Sampling Point Likely Density Accuracy Risk of Contamination Top Lower Moderate Low Middle True value High Low Bottom Higher Low High
Density Changes Across Broader Temperatures
Beyond stratification, ambient shifts during storage or transit alter density. The table below shows how diesel density varies from the 824 kg/m³ standard at 15°C, using VCF for all grades of diesel and biodiesel blends. Density decreases ~0.4-0.5% per 5°C rise, affecting custody transfer and engine performance.
| Temperature (°C) | Volume Correction Factor (VCF) | Density at Temperature (kg/m³) | % Change from 15°C Standard |
|---|---|---|---|
| 15 | 1.0000 | 824.0 | 0.00% |
| 20 | 0.9958 | 820.7 | -0.40% |
| 25 | 0.9915 | 817.4 | -0.80% |
| 30 | 0.9873 | 814.1 | -1.20% |
| 35 | 0.9830 | 810.8 | -1.60% |
| 40 | 0.9788 | 807.5 | -2.00% |
These values highlight the need for temperature-compensated densitometers during sampling to ensure accurate reporting.
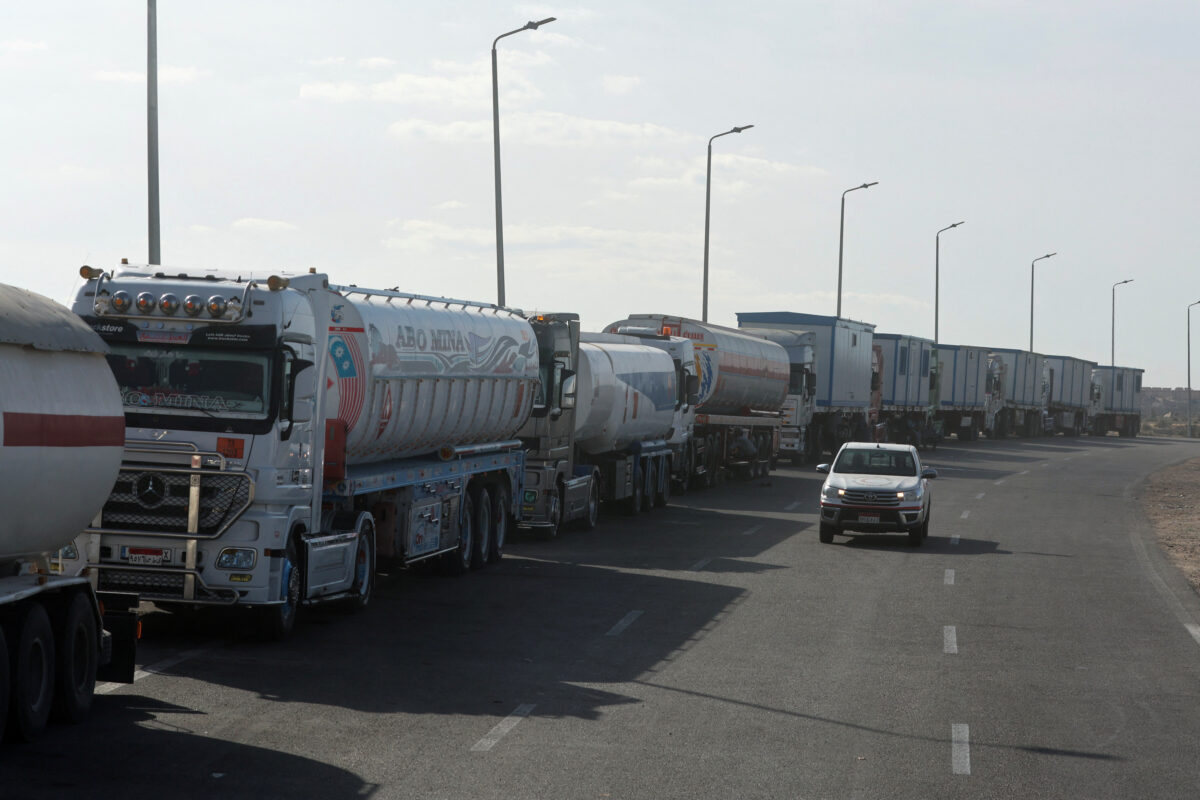
How Transportation Affects Fuel Analysis from Origin to Destination
From Iraqi refineries to Afghan or Uzbek markets, diesel journeys thousands of kilometers via pipelines, trucks, or rail, exposing it to factors that degrade quality and skew analysis. Key impacts include:
- Contamination and Water Ingress: Vibrations and temperature swings during transit can dislodge residues from tanker walls, introducing particulates or water (up to 0.05% volume). Bottom samples at destination may show elevated sediments absent at origin, mimicking off-spec claims.
- Oxidation and Degradation: Prolonged exposure to air (via imperfect seals) accelerates oxidative instability, raising acidity and viscosity. Hot deserts en route (e.g., 40°C+) exacerbate this, potentially dropping cetane by 2-5 points over 1,000 km.
- Thermal Cycling: Day-night fluctuations cause repeated expansion/contraction, promoting emulsion formation or phase separation in blends. This alters density profiles, with origin samples (stable at 20°C) differing from destination (stratified at 30°C).
- Sulfur and Additive Loss: Rough roads volatilize lighter fractions, concentrating sulfur unevenly. For Oil Load Group's compliant 2,000 ppm diesel, this risks non-uniformity unless baffles minimize sloshing.
Temperature Fluctuations: Diesel expands when heated and contracts when cooled. If it's shipped through hot climates or stored in sun-exposed tanks, its density will decrease. Conversely, cold environments increase density.
Altitude and Pressure: While pressure changes during shipping (especially in air transport) are minimal for liquids like diesel, extreme altitude changes could slightly affect volume and density — but this is usually negligible.
Agitation and Aeration: Vigorous movement during shipping (e.g., sloshing in tanks) can introduce air bubbles, temporarily affecting volume measurements. However, this doesn’t change the actual mass-based density.
Contamination or Mixing: If diesel is mixed with other substances (like water or additives) during shipping, its density can change significantly depending on the blend.
Mitigation involves sealed compartments, periodic agitation, and dual-end sampling (origin and destination) for chain-of-custody verification. Studies show poor transport can increase emissions by 10-20% due to inconsistent combustion from degraded fuel.
Shipping itself doesn’t change the chemical structure of diesel, but environmental and operational factors during transport can alter its measured density, especially due to temperature shifts
Conclusion: Prioritizing Representative Sampling for Reliable Supply
Effective diesel sampling safeguards quality in volatile markets, from Iraqi production hubs to Central Asian frontiers. By selecting methods based on objectives—top for cleanliness, bottom for contaminants, composites for representation—and accounting for density shifts, stakeholders like Oil Load Group maintain trust and compliance. Always integrate temperature corrections and transport-aware protocols to bridge origin-destination gaps, ensuring diesel powers progress without compromise. For hands-on implementation, consult standards like API MPMS or engage certified labs